Handling of native Excel charts in XLSX.jl is experimental and a work in progress. All aspects may be subject to change. Feedback is welcome!
Creating charts
julia> using XLSX, XLSX.ChartsaddChart makes an empty chart of a given kind, and addSeries fills it. This page covers the c: schema; the newer kinds are in Creating chartEx charts.
A chart on a worksheet
julia> f = XLSX.newxlsx();

julia> ws = f[1];

julia> ws["A1"] = ["Region", "2024"];

julia> ws["A2:A5"] = ["North", "South", "East", "West"];

julia> ws["B2:B5"] = [10.0, 20.0, 15.0, 5.0];

julia> c = addChart(ws, :column; anchor = "D2:K17", title = "Revenue");

julia> addSeries(c, "B2:B5"; categories = "A2:A5", name_ref = "B1");

julia> XLSX.writexlsx("revenue.xlsx", f)
"C:\\Users\\...\\revenue.xlsx"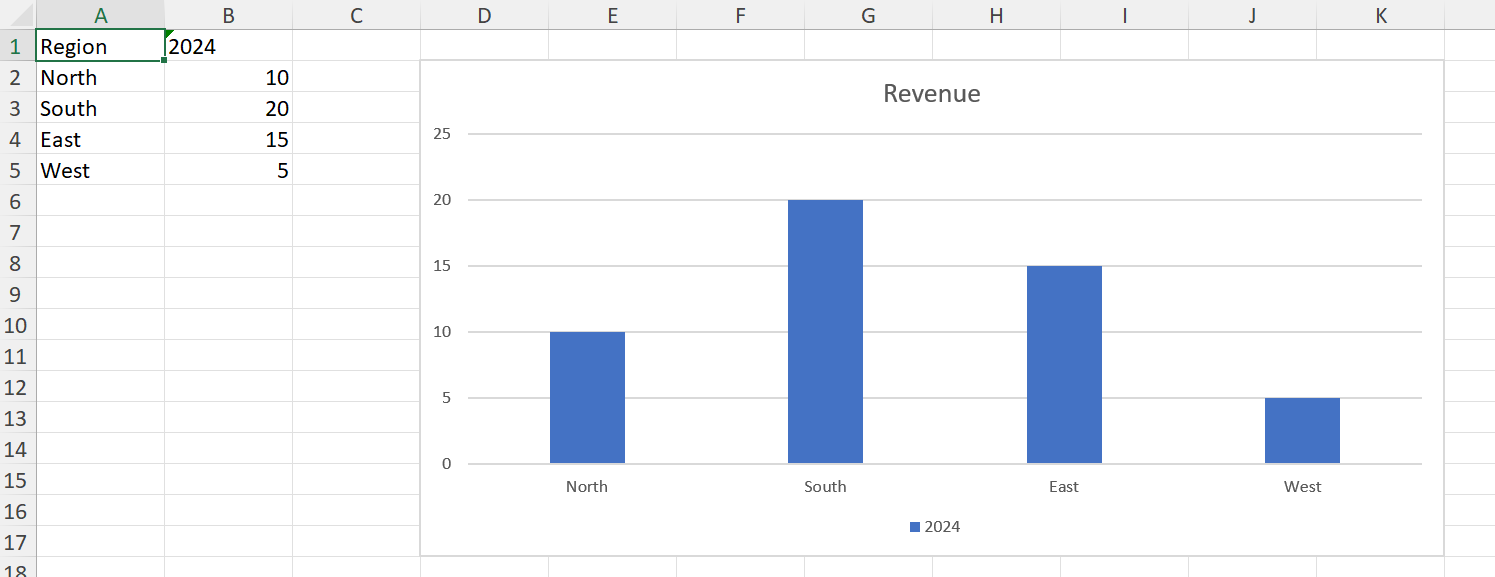
anchor is required, and is the cell range the chart covers — its top-left and bottom-right corners on the sheet. title is nothing for the title Excel generates itself, a string for typed text, or false for no title at all.
A chart is created empty because a c: chart part is valid with no series, so addChart and addSeries can be separate steps. That is not true of the cx: schema, where the data block is required.
The kinds
kind is one of these, each named after the Excel subtype it creates:
| Clustered or plain | Stacked | 100% stacked | |
|---|---|---|---|
| Column (vertical bars) | :column | :stackedColumn | :percentStackedColumn |
| Bar (horizontal) | :bar | :stackedBar | :percentStackedBar |
| Line | :line | :stackedLine | :percentStackedLine |
| Line with markers | :lineMarkers | :stackedLineMarkers | :percentStackedLineMarkers |
| Area | :area | :stackedArea | :percentStackedArea |
and :pie, :doughnut, :scatter, :bubble, :radar and :filledRadar, and :combo, a column and a line chart in one; see Combo charts.
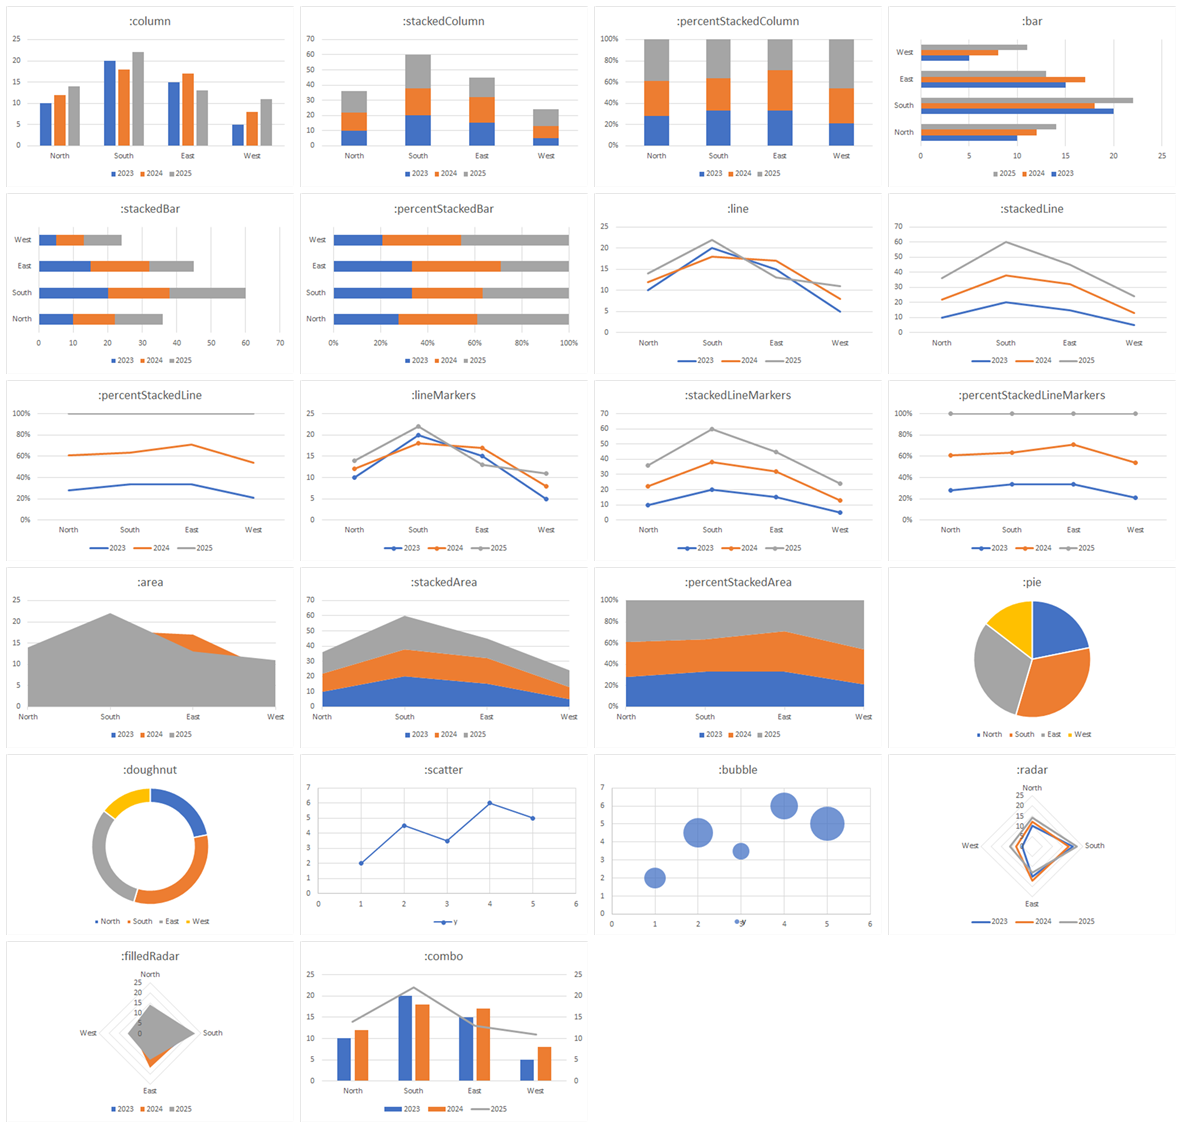
Each comes from a chart part Excel itself wrote, kept verbatim in the package, so a created chart is what Excel would have produced for that kind — including its style and color parts. Kinds with no template yet throw rather than approximate; see Limitations.
A chart on its own sheet
Pass the file rather than a worksheet to create a chartsheet:
julia> cs = addChart(f, :line; sheetname = "Trend", title = "Revenue over time");sheetname defaults to Chart1, Chart2, … as Excel names them. A chartsheet holds one chart, positioned absolutely rather than anchored to cells, so there is no anchor to give.
Its series still take their data from a worksheet, and must name the sheet, since there is no sheet of its own for an unqualified range to mean:
julia> addSeries(cs, "Sheet1!B2:B5"; categories = "Sheet1!A2:A5");Referring to data
A series' values, categories, name_ref and bubble_sizes all take the same forms:
- A range string —
"B2:B5", or"Sheet1!B2:B5"to name the sheet. An unqualified range means the chart's own sheet. - A defined name, which resolves through the workbook.
- A reference object:
XLSX.SheetCellRange,XLSX.CellRangeand the rest of the range types.
For a table, XLSX.gettablerange gives the ranges, header cell included:
julia> ts = XLSX.addsheet!(f, "Sales");

julia> ts["A1"] = "Region"; ts["B1"] = "Item"; ts["C1"] = "Amount";

julia> ts["A2:A6"] = reshape(["North", "North", "South", "South", "East"], 5, 1);

julia> ts["B2:B6"] = reshape(["Widgets", "Gadgets", "Widgets", "Gadgets", "Widgets"], 5, 1);

julia> ts["C2:C6"] = reshape([120.0, 85.0, 200.0, 140.0, 95.0], 5, 1);

julia> t = XLSX.addtable!(ts, "A1:C6"; name = "Sales", style="TableStyleMedium2");

julia> tc = addChart(ts, :column; anchor = "E2:L18", title = "Sales by item");

julia> addSeries(tc, XLSX.gettablerange(t, "Amount");
                 categories = XLSX.gettablerange(t, "Item"),
                 name_ref = XLSX.gettablerange(t, "Amount"; header = true));

julia> only(getChartSeries(tc)).name
"Amount"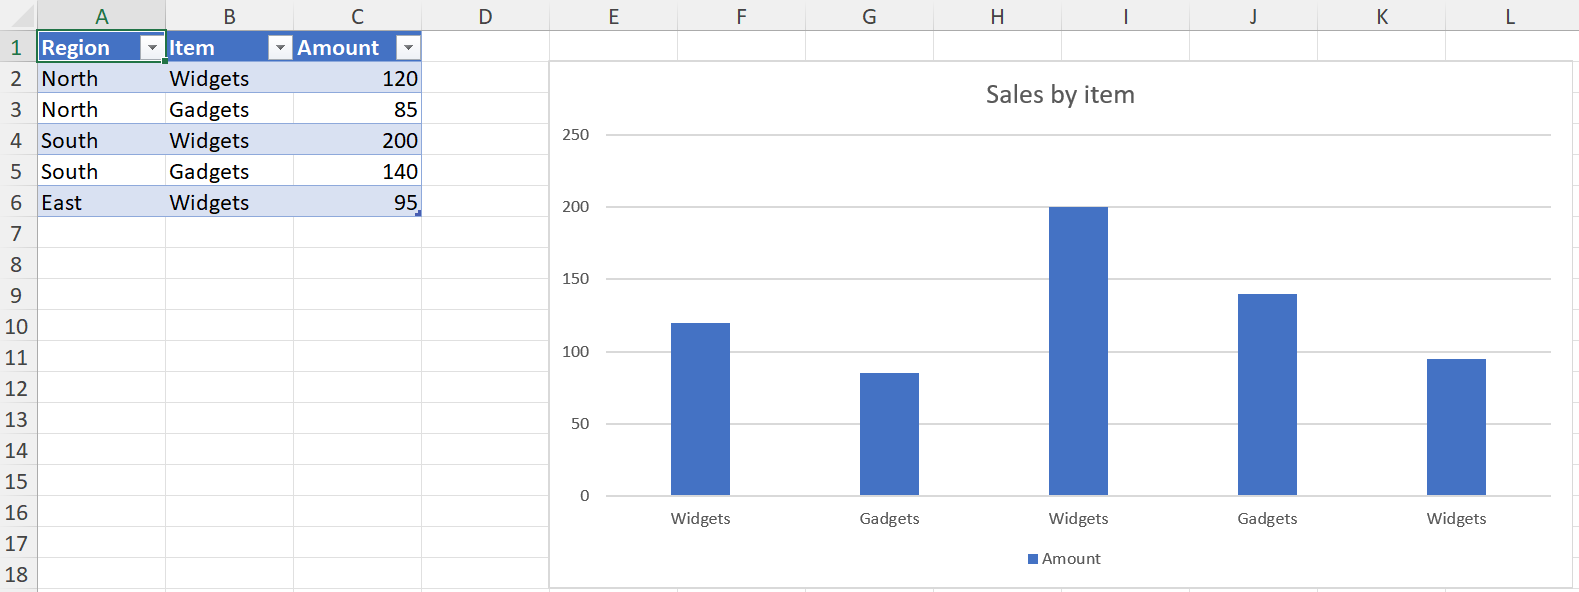
Whatever you pass, the chart part stores a sheet-qualified absolute reference, as Excel does. The cells' current values are cached in the chart at the same time, so the series reads back without opening the file in Excel — see the chart cache.
Cells holding formulas written by XLSX.setFormula have no values until Excel recalculates them, so a series plotting them is cached empty. Excel recalculates when it opens the file and draws the chart from the results, so it looks the same there; only reading the series back before then finds no values. A Likert chart plots formulas this way, so that sorting the data in Excel reorders the chart.
name and name_ref differ: name is the series name as literal text, while name_ref points at a cell holding it, which is what Excel writes when you select a header row. Pass one or neither, not both.
Series options
addSeries takes the common formatting inline, so a series can be styled as it is added rather than in a second pass:
julia> addSeries(c, "C2:C5"; categories = "A2:A5", name = "2025", color = "FF0000");| Keyword | Applies to | Takes |
|---|---|---|
color | everything but pie and doughnut | a color name, hex, a Colorant, a SchemeColor, or a scheme name such as "accent4" |
markers | every line kind, radar (not filled), scatter | a symbol such as :circle, or false for none |
smooth | every line kind, scatter | true or false — whether the line is curved |
line | scatter | true to join the points |
An option that doesn't apply to the chart's kind throws rather than being ignored, so a mistake is caught rather than silently dropped. Pie and doughnut charts color their points individually rather than by series, which is why color has no meaning there.
Without color, series take the theme's accent colors in turn, as Excel does. Anything not covered here is set afterwards with the functions in Formatting charts.
A few combinations are rejected because the result would draw nothing or is under-specified: a bubble series needs both categories (its X values) and bubble_sizes, and a scatter series with markers = false needs line = true.
Chart subtypes
Excel's Insert menu offers several subtypes of most chart kinds. Some of them are set series by series with the keywords above, and others are separate kinds.
Scatter
There is one :scatter kind. Each series chooses one of Excel's five scatter subtypes with markers, line and smooth:
| Excel subtype | addSeries keywords |
|---|---|
| Scatter | none: markers only is the default |
| Scatter with Smooth Lines and Markers | line = true, smooth = true |
| Scatter with Smooth Lines | line = true, smooth = true, markers = false |
| Scatter with Straight Lines and Markers | line = true |
| Scatter with Straight Lines | line = true, markers = false |
julia> c = addChart(ws, :scatter; anchor = "D2:K17", title = "Smooth lines");

julia> addSeries(c, "B2:B6"; categories = "A2:A6", name_ref = "B1",
                 line = true, smooth = true, markers = false);
On a scatter or bubble chart categories holds the X values, which Excel calls "Series X values" and writes as c:xVal. The keyword has the same name for every chart kind, and getChartData and getChartRanges read the X values back as categories too.
Line and radar
Line and radar charts take their subtypes from markers in the same way:
| Excel subtype | How to create it |
|---|---|
| Line | :line |
| Line with Markers | :lineMarkers, or markers = true (or a symbol) on a :line series |
| Stacked Line with Markers | :stackedLineMarkers, or markers = true on a :stackedLine series |
| 100% Stacked Line with Markers | :percentStackedLineMarkers, or markers = true on a :percentStackedLine series |
| Radar | :radar |
| Radar with Markers | :radar with markers = true (or a symbol) |
smooth = true curves a line series. Excel offers this in the series' format pane rather than as a subtype. Filled radar is a kind of its own, :filledRadar, and takes neither keyword: its series are filled areas.
Subtypes that are separate kinds
The stacked and 100% stacked subtypes of column, bar, line and area are kinds, in the table under The kinds, as are:
| Excel subtype | Kind |
|---|---|
| Pie, Doughnut | :pie, :doughnut |
| Filled Radar | :filledRadar |
| Bubble | :bubble |
| Clustered Column – Line on Secondary Axis | :combo |
Subtypes that cannot be created
Excel's 3-D subtypes, and its stock, surface and of-pie charts, can't be created yet. They can still be read. See Limitations.
The subtype keywords apply to one series at a time, so one chart can mix subtypes, as it can in Excel.
Adding to a chart Excel made
addSeries reads the chart's kind back from the part rather than from anything the package recorded, so it works on a chart Excel created exactly as on one addChart made:
julia> g = XLSX.opentemplate("chart_basic.xlsx");

julia> ec = getCharts(g)[1]
XLSX.Charts.Chart "chart1" on sheet "Data" at G9:N23
  title: "Revenue by Region"
  type: barChart
  series: 2
    [1] 2024 - Data!$B$2:$B$5 (4 pts)
    [2] 2025 - Data!$C$2:$C$5 (4 pts)

julia> addSeries(ec, "Data!D2:D5"; categories = "Data!A2:A5", name = "2026");

julia> ec
XLSX.Charts.Chart "chart1" on sheet "Data" at G9:N23
  title: "Revenue by Region"
  type: barChart
  series: 3
    [1] 2024 - Data!$B$2:$B$5 (4 pts)
    [2] 2025 - Data!$C$2:$C$5 (4 pts)
    [3] 2026 - Data!$D$2:$D$5 (4 pts)
The new series takes the next accent color and the chart's own style, so it looks like the ones already there.
julia> [getSeriesFill(ec, i).value.fgcolor.val for i in 1:3]
3-element Vector{String}:
 "accent1"
 "accent2"
 "accent3"
A chart with more than one group — a combo chart — takes a group keyword to say which group a series joins; see Combo charts.
Combo charts
:combo is Excel's "Clustered Column – Line on Secondary Axis": a column group on the primary axes and a line group on secondary axes of its own, so the two can plot values of different sizes. Pass group to say which group each series joins:
julia> ws["A1"] = ["" "Units" "Margin"; "Q1" 120 0.31; "Q2" 135 0.28; "Q3" 150 0.35; "Q4" 160 0.33];

julia> cc = addChart(ws, :combo; anchor = "D2:K17", title = "Units and margin");

julia> addSeries(cc, "B2:B5"; categories = "A2:A5", name_ref = "B1", group = :column);

julia> addSeries(cc, "C2:C5"; categories = "A2:A5", name_ref = "C1", group = :line);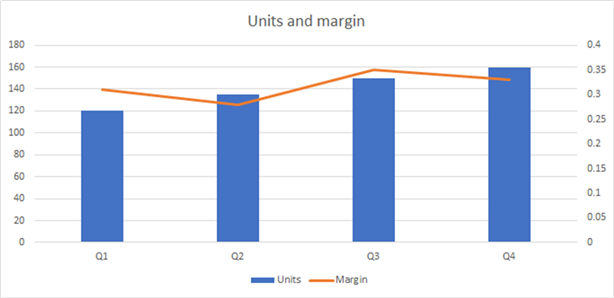
group is :column or :line. It is required on a combo chart and refused on any other, so a series can't land in a group by accident. Each series is formatted as Excel formats one in that group, and takes the options of a :column or :line series: markers = true on a line gives Excel's Line with Markers formatting, and smooth curves it. Series are numbered, and take the accent colors in turn, across the whole chart, as Excel numbers them.
The same works on a combo chart Excel made, provided it has one column group or one line group to add to; a chart with neither, or with two of the one asked for, throws. Changing which axes a group uses is not supported.
Making a chart a combo chart
makeCombo turns an existing :column, :stackedColumn or :line chart into the same combo, as Excel's Change Chart Type → Combo does. The last series becomes the line, on new secondary axes, and the others clustered columns:
julia> c = addChart(ws, :column; anchor = "D20:K35");

julia> addSeries(c, "B2:B5"; categories = "A2:A5", name_ref = "B1");

julia> addSeries(c, "C2:C5"; categories = "A2:A5", name_ref = "C1");

julia> makeCombo(c);

julia> [s.charttype for s in getChartSeries(c)]
2-element Vector{Symbol}:
 :barChart
 :lineChart
What Excel keeps, makeCombo keeps: the chart's title, legend and axes, axis titles included, and the formatting of each series that stays a column (or, from a line chart, the line). A series that changes type takes the formatting Excel gives a series of its new group, keeping its name, data and data labels. A stacked chart's columns become clustered, as in Excel. The chart needs two series or more; to start a combo from nothing, use addChart(ws, :combo; …).
Deleting a chart
deleteChart deletes a chart on a worksheet, whether XLSX.jl or Excel made it, with everything only it uses. The data it plotted is not changed:
julia> deleteChart(getChart(xf, "chart1"))A chart on a chartsheet is the whole sheet: delete it with XLSX.deletesheet!.
Themes
A created chart's colors are theme references, not fixed values, so the chart follows the workbook's theme the way Excel's own charts do.
One consequence worth knowing: a workbook from XLSX.newxlsx() carries an older Office theme than current Excel, so charts created in a new workbook show that theme's colors rather than the ones Excel 365 would use. A chart added to a workbook Excel created uses that workbook's theme and matches.
See also
- API: Charts, Chart axes and elements
- Related guides: Formatting charts, Creating chartEx charts
- Examples: Adding a simple native Excel chart, A diverging stacked bar chart